Mora Public Schools Curriculum and Assessment Information

Mora has consistently performed above the state average for several years. Want to know more about Mora Public Schools? Go to the Minnesota Department of Education School Report Card.

Darcy Qual-Curriculum Director

Darcy Qual

Director of Teaching and Learning/District Assessment Coordinator

dqual@moraschools.org

(320) 679-6200 Ext. 7515
District Testing Calendar 2026-2027

State MCA Proficiency Data

Mora Public Schools performed quite well compared to local school districts.

Minnesota Report Card can give you more information about scores from Mora Public Schools and other Minnesota Districts.

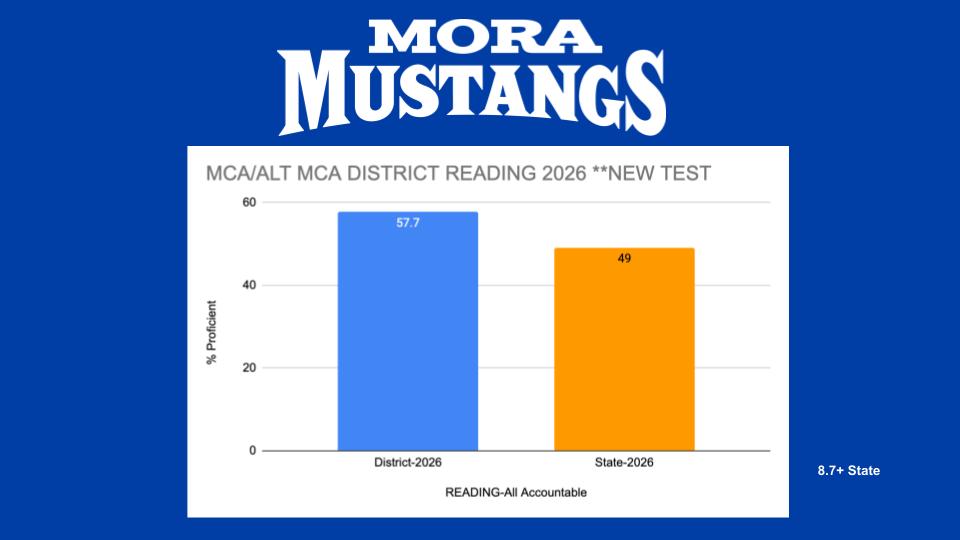
Visual Description:A presentation slide with a solid royal blue background featuring the Mora Mustangs logo at the top and an embedded white rectangular bar graph comparing 2026 standardized reading test results between the Mora school district and the state of Minnesota.   Header:Logo (Top Center): "MORA MUSTANGS" displayed in bold white lettering with blue shading.   Chart Title & Labels:Chart Title: "MCA/ALT MCA DISTRICT READING 2026 **NEW TEST"   Y-Axis: Labeled "% Proficient" with gridline markers at 0, 20, 40, and 60.   X-Axis: Labeled "READING-All Accountable" below two comparison categories:   District-2026   State-2026   Data Values (Proficiency Comparison):District-2026 (Blue Bar): 57.7% proficient   State-2026 (Orange Bar): 49% proficient   Slide Note (Bottom Right):White text reading "8.7+ State", indicating the district scored 8.7 percentage points above the statewide proficiency rate.

Mora Public Schools bar chart comparing 2026 MCA Reading proficiency, showing the district at 57.7% proficient compared to the state average of 49%.
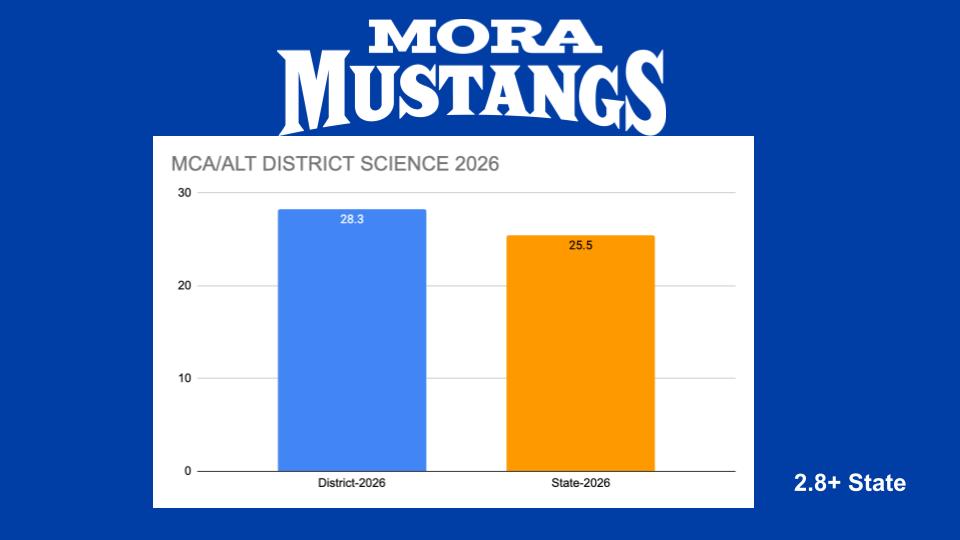
Visual Description:A presentation slide with a solid royal blue background featuring the Mora Mustangs logo centered at the top and an embedded white rectangular bar graph comparing 2026 standardized science test proficiency between the Mora school district and the state of Minnesota.   Header:Logo (Top Center): "MORA MUSTANGS" displayed in bold white lettering with blue inner drop shadows.   Chart Title & Labels:Chart Title: "MCA/ALT DISTRICT SCIENCE 2026"   Y-Axis: Scale running from 0 to 30 with horizontal gridlines at 0, 10, 20, and 30.   X-Axis: Lists two comparison categories:   District-2026   State-2026   Data Values (Proficiency Comparison):District-2026 (Blue Bar): 28.3% proficient   State-2026 (Orange Bar): 25.5% proficient   Slide Note (Bottom Right):White text reading "2.8+ State", denoting that the district outperformed the statewide proficiency average by 2.8 percentage points.

Mora Public Schools bar chart comparing 2026 MCA Science proficiency, showing the district at 28.3% proficient compared to the state average of 25.5%.
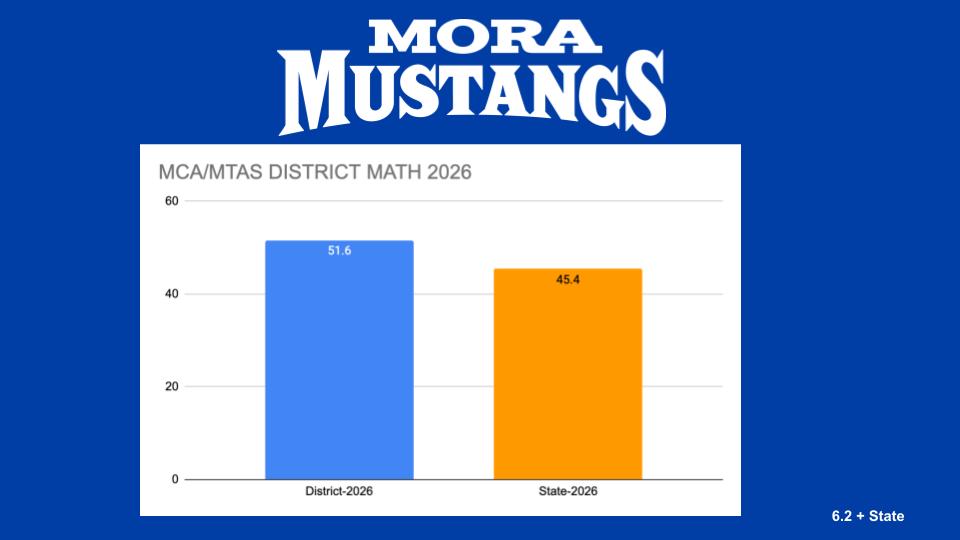
Visual Description:A presentation slide with a solid royal blue background featuring the Mora Mustangs logo centered at the top and an embedded white rectangular bar graph comparing 2026 standardized mathematics test proficiency between the Mora school district and the state of Minnesota.   Header:Logo (Top Center): "MORA MUSTANGS" displayed in bold white lettering with blue inner drop shadows.   Chart Title & Labels:Chart Title: "MCA/MTAS DISTRICT MATH 2026"   Y-Axis: Scale running from 0 to 60 with horizontal gridlines at 0, 20, 40, and 60.   X-Axis: Lists two comparison categories:   District-2026   State-2026   Data Values (Proficiency Comparison):District-2026 (Blue Bar): 51.6% proficient   State-2026 (Orange Bar): 45.4% proficient   Slide Note (Bottom Right):White text reading "6.2 + State", indicating the district exceeded the statewide math proficiency rate by 6.2 percentage points.

Mora Public Schools bar chart comparing 2026 MCA Math proficiency, showing the district at 51.6% proficient compared to the state average of 45.4%.

For information, please view the following links.